
All Other Chemical Product and Preparation Manufacturing - Market Size, Financial Statistics, Industry Trends
Industry Overview
This industry comprises establishments primarily engaged in manufacturing chemical products (except basic chemicals, resins, and synthetic rubber; cellulosic and noncellulosic fibers and filaments; pesticides, fertilizers, and other agricultural chemicals; pharmaceuticals and medicines; paints, coatings, and adhesives; soaps, cleaning compounds, and toilet preparations; printing inks; and explosives). Illustrative Examples: Activated carbon and charcoal manufacturing Antifreeze preparations manufacturing Custom compounding (i.e., blending and mixing) of purchased plastics resins Electronic cigarette vapor liquids, including closed refills, manufacturing Industrial salt manufacturing Matches and matchbook manufacturing Photographic chemicals manufacturing Pyrotechnics (e.g., flares, flashlight bombs, signals) manufacturing Sugar substitutes (i.e., synthetic sweeteners blended with other ingredients) made from purchased synthetic sweeteners Swimming pool chemical preparations manufacturing Writing inks manufacturing Cross-References. Establishments primarily engaged in--Source: U.S. Census Bureau
All Other Chemical Product and Preparation Manufacturing Market Size
This report includes historical and forecasted market sizes and industry trends for All Other Chemical Product and Preparation Manufacturing. It reveals overall market dynamics from 2021 through the present, and predicts industry growth or shrinkage through 2031. Revenue data include both public and private companies in the All Other Chemical Product and Preparation Manufacturing industry.| Historical | Forecasted | ||||||||||
|---|---|---|---|---|---|---|---|---|---|---|---|
| 2021 | 2022 | 2023 | 2024 | 2025 | 2026 | 2027 | 2028 | 2029 | 2030 | 2031 | |
| Market Size (Total Revenue) | Included in Report |
||||||||||
| % Growth Rate | |||||||||||
| Number of Companies | |||||||||||
| Total Employees | |||||||||||
| Average Revenue per Company | |||||||||||
| Average Employees per Company | |||||||||||
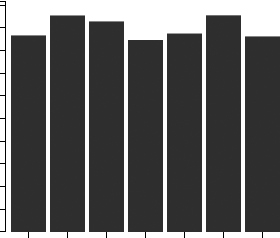
Industry Revenue ($ Billions)
Industry Forecast ($ Billions)
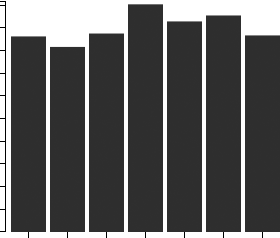
Pell Research's advanced econometric models forecast five years of industry growth based on short- and long-term trend analysis. Market size statistics include revenue generated from all products and services sold within the All Other Chemical Product and Preparation Manufacturing industry.
Geographic Breakdown by U.S. State
All Other Chemical Product and Preparation Manufacturing market share by state pinpoints local opportunities based on regional revenue statistics. Growth rate for each state is affected by regional economic conditions. Data by state can be used to locate profitable and nonprofitable locations for All Other Chemical Product and Preparation Manufacturing companies in the United States.Industry Revenue by State

Distribution by Company Size
| Company Size | All Industries | All Other Chemical Product and Preparation Manufacturing |
|---|---|---|
| Small Business (< 5 Employees) | Included |
|
| Small Business (5 - 20) | ||
| Midsized Business (20 - 100) | ||
| Large Business (100 - 500) | ||
| Enterprise (> 500) | ||
Industry Income Statement (Average Financial Metrics)
Financial statement analysis determines averages for the following industry forces:- Cost of goods sold
- Compensation of officers
- Salaries and wages
- Employee benefit programs
- Rent paid
- Advertising and marketing budgets
The report includes a traditional income statement from an "average" All Other Chemical Product and Preparation Manufacturing company (both public and private companies are included).
| Industry Average | Percent of Sales | |
|---|---|---|
| Total Revenue | Included |
|
| Operating Revenue | ||
| Cost of Goods Sold (COGS) | ||
| Gross Profit | ||
| Operating Expenses | ||
| Operating Income | ||
| Non-Operating Income | ||
| Earnings Before Interest and Taxes (EBIT) | ||
| Interest Expense | ||
| Earnings Before Taxes | ||
| Income Tax | ||
| Net Profit | ||
Average Income Statement

Cost of Goods Sold
Salaries, Wages, and Benefits
Rent
Advertising
Depreciation and Amortization
Officer Compensation
Net Income
Financial Ratio Analysis
Financial ratios allow a company's performance to be compared against that of its peers.| Financial Ratio | Industry Average |
|---|---|
| Profitability Ratios | Included |
| Profit Margin | |
| ROE | |
| ROA | |
| Liquidity Ratios | |
| Current Ratio | |
| Quick Ratio | |
| Activity Ratios | |
| Average Collection Period | |
| Asset Turnover Ratio | |
| Receivables Turnover Ratio | |
| Inventory Conversion Ratio |
Products and Services Mix
Product lines and services in the All Other Chemical Product and Preparation Manufacturing industry accounting for the largest revenue sources.| Product Description | Description | Revenue ($ Millions) |
|
|---|---|---|---|
Custom compounding of purchased resins |
Included |
||
Custom compounding of purchased resins and color concentrates |
|||
Custom compounding of purchased resins, nsk, total |
|||
Cust. compounding of purchased resins nsk, admin-record estabs |
|||
Photographic film and chemical manufacturing |
|||
Photographic sensitized film/plates/etc., silver halide type |
|||
Sensitized photographic film/plates/etc., not silver halide type |
|||
Prepared photographic chemicals |
|||
Prepared photographic chemicals, office copy toners |
|||
Prepared photographic plate chemicals |
|||
Compensation and Salary Surveys
Salary information for employees working in the All Other Chemical Product and Preparation Manufacturing industry.| Title | Percent of Workforce | Bottom Quartile | Average (Median) Salary | Upper Quartile |
|---|---|---|---|---|
| Management Occupations | 9% |
Included |
||
| Chief Executives | 0% | |||
| General and Operations Managers | 2% | |||
| Business and Financial Operations Occupations | 6% | |||
| Architecture and Engineering Occupations | 6% | |||
| Engineers | 5% | |||
| Life, Physical, and Social Science Occupations | 9% | |||
| Office and Administrative Support Occupations | 10% | |||
| Installation, Maintenance, and Repair Occupations | 6% | |||
| Other Installation, Maintenance, and Repair Occupations | 5% | |||
| Production Occupations | 40% | |||
| Other Production Occupations | 28% | |||
| Chemical Processing Machine Setters, Operators, and Tenders | 9% | |||
| Chemical Equipment Operators and Tenders | 8% | |||
| Crushing, Grinding, Polishing, Mixing, and Blending Workers | 6% | |||
| Mixing and Blending Machine Setters, Operators, and Tenders | 6% | |||
| Packaging and Filling Machine Operators and Tenders | 6% | |||
| Packaging and Filling Machine Operators and Tenders | 6% | |||
| Transportation and Material Moving Occupations | 5% | |||
Government Contracts
The federal government spent an annual total of $225,560,614 on the All Other Chemical Product and Preparation Manufacturing industry. It has awarded 6,596 contracts to 563 companies, with an average value of $400,641 per company.Top Companies in All Other Chemical Product and Preparation Manufacturing and Adjacent Industries
| Company | Address | Revenue ($ Millions) |
|---|---|---|
Included |
||