Manufacturing - Market Size, Financial Statistics, Industry Trends

Industry Overview

The Sector as a Whole The Manufacturing sector comprises establishments engaged in the mechanical, physical, or chemical transformation of materials, substances, or components into new products. The assembling of component parts of manufactured products is considered manufacturing, except in cases where the activity is appropriately classified in Sector 23, Construction. Establishments in the Manufacturing sector are often described as plants, factories, or mills and characteristically use power-driven machines and material handling equipment. However, establishments that transform materials or substances into new products by hand or in the workers home and those engaged in selling to the general public products made on the same premises from which they are sold, such as bakeries, candy stores, and custom tailors, may also be included in this sector. Manufacturing establishments may process materials or may contract with other establishments to process their materials for them. Both types of establishments are included in manufacturing. Selected industries in the Manufacturing sector are comprised solely of establishments that process materials for other establishments on a contract or fee basis. Beyond these dedicated contract manufacturing industries, establishments that process materials for other establishments are generally classified in the Manufacturing industry of the processed materials. The materials, substances, or components transformed by manufacturing establishments are raw materials that are products of agriculture, forestry, fishing, mining, or quarrying as well as products of other manufacturing establishments. The materials used may be purchased directly from producers, obtained through customary trade channels, or secured without recourse to the market by transferring the product from one establishment to another, under the same ownership. The new product of a manufacturing establishment may be finished in the sense that it is ready for utilization or consumption, or it may be semi-finished to become an input for an establishment engaged in further manufacturing. For example, the product of the alumina refinery is the input used in the primary production of aluminum; primary aluminum is the input to an aluminum wire drawing plant; and aluminum wire is the input for a fabricated wire product manufacturing establishment. The subsectors in the Manufacturing sector generally reflect distinct production processes related to material inputs, production equipment, and employee skills. In the machinery area, where assembling is a key activity, parts and accessories for manufactured products are classified in the industry of the finished manufactured item when they are made for separate sale. For example, an attachment for a piece of metalworking machinery would be classified with metalworking machinery. However, component inputs from other manufacturing establishments are classified based on the production function of the component manufacturer. For example, electronic components are classified in Subsector 334, Computer and Electronic Product Manufacturing, and stampings are classified in Subsector 332, Fabricated Metal Product Manufacturing. Manufacturing establishments often perform one or more activities that are classified outside the Manufacturing sector of NAICS. For instance, almost all manufacturing has some captive research and development or administrative operations, such as accounting, payroll, or management. These captive services are treated the same as captive manufacturing activities. When the services are provided by separate establishments, they are classified in the NAICS sector where such services are primary, not in manufacturing. The boundaries of manufacturing and the other sectors of the classification system can be somewhat blurry. The establishments in the Manufacturing sector are engaged in the transformation of materials into new products. Their output is a new product. However, the definition of what constitutes a new product can be somewhat subjective. As clarification, the following activities are considered manufacturing in NAICS:
Milk bottling and pasteurizing;
Water bottling and processing;
Fresh fish packaging (oyster
shucking, fish filleting);
Apparel jobbing (assigning
materials to contract
factories or shops for
fabrication or other contract
operations) as well as
contracting on materials
owned by others;
Printing and related activities;
Ready-mix concrete production;
Source: U.S. Census Bureau

Manufacturing Market Size

This report includes historical and forecasted market sizes and industry trends for Manufacturing. It reveals overall market dynamics from 2020 through the present, and predicts industry growth or shrinkage through 2030. Revenue data include both public and private companies in the Manufacturing industry.

Historical Forecasted
2020 2021 2022 2023 2024 2025 2026 2027 2028 2029 2030
Market Size (Total Revenue)

Included in Report

% Growth Rate
Number of Companies
Total Employees
Average Revenue per Company
Average Employees per Company
Source: U.S. government financial data

Industry Revenue ($ Billions)

Manufacturing Industry Market Size
  • 2018
  • 2019
  • 2020
  • 2021
  • 2022
  • 2023
  • 2024

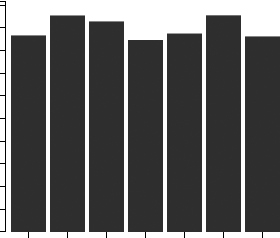
Industry Forecast ($ Billions)

Manufacturing Industry Forecast
  • 2024
  • 2025
  • 2026
  • 2027
  • 2028
  • 2029
  • 2030


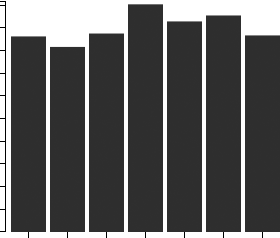
Pell Research's advanced econometric models forecast five years of industry growth based on short- and long-term trend analysis. Market size statistics include revenue generated from all products and services sold within the Manufacturing industry.

Geographic Breakdown by U.S. State

Manufacturing market share by state pinpoints local opportunities based on regional revenue statistics. Growth rate for each state is affected by regional economic conditions. Data by state can be used to locate profitable and nonprofitable locations for Manufacturing companies in the United States.

Industry Revenue by State [Sample]

Market Size by State

Distribution by Company Size

Company Size All Industries Manufacturing
Small Business (< 5 Employees)

Included

Small Business (5 - 20)
Midsized Business (20 - 100)
Large Business (100 - 500)
Enterprise (> 500)

Industry Income Statement (Average Financial Metrics)

Financial statement analysis determines averages for the following industry forces:
  • Cost of goods sold
  • Compensation of officers
  • Salaries and wages
  • Employee benefit programs
  • Rent paid
  • Advertising and marketing budgets

The report includes a traditional income statement from an "average" Manufacturing company (both public and private companies are included).

Industry Average Percent of Sales
Total Revenue

Included

Operating Revenue
Cost of Goods Sold (COGS)
Gross Profit
Operating Expenses
Operating Income
Non-Operating Income
Earnings Before Interest and Taxes (EBIT)
Interest Expense
Earnings Before Taxes
Income Tax
Net Profit


Average Income Statement

Average Income Statement

Cost of Goods Sold

Salaries, Wages, and Benefits

Rent

Advertising

Depreciation and Amortization

Officer Compensation

Net Income


Financial Ratio Analysis

Financial ratios allow a company's performance to be compared against that of its peers.

Financial RatioIndustry Average
Profitability Ratios

Included

Profit Margin
ROE
ROA
Liquidity Ratios
Current Ratio
Quick Ratio
Activity Ratios
Average Collection Period
Asset Turnover Ratio
Receivables Turnover Ratio
Inventory Conversion Ratio

Products and Services Mix

Product lines and services in the Manufacturing industry accounting for the largest revenue sources.

Product Description Description Revenue
($ Millions)

Al insulated wire & cable, made in Al rolling & drawing plants

Included

Iron and steel mills

Coke oven and blast furnace products, made in steel mills

Coke oven prods., coke (exc. screenings/breeze), steel mills

Coke oven products, screenings and breeze, steel mills

Coke oven products, crude tar, made in steel mills

Coke oven products, crude light oil, made in steel mills

Blast furnace pig iron (exc. ferroalloys), steel mills

Blast furnace slag, excluding ferroalloys, steel mills

Coke oven and blast furnace products, steel mills, nsk


Compensation and Salary Surveys

Salary information for employees working in the Manufacturing industry.

TitlePercent of Workforce Bottom Quartile Average (Median) Salary Upper Quartile
Management Occupations 4%

Included

Chief Executives 0%
General and Operations Managers 1%
Operations Specialties Managers 5%
Business and Financial Operations Occupations 6%
Business Operations Specialists 6%
Computer and Mathematical Occupations 6%
Computer Occupations 6%
Software Developers and Programmers 9%
Software Developers, Applications 11%
Software Developers, Systems Software 10%
Computer Support Specialists 5%
Architecture and Engineering Occupations 5%
Engineers 7%
Aerospace Engineers 5%
Electrical and Electronics Engineers 6%
Electronics Engineers, Except Computer 5%
Drafters, Engineering Technicians, and Mapping Technicians 6%
Engineering Technicians, Except Drafters 5%
Sales and Related Occupations 5%
Office and Administrative Support Occupations 7%
Material Recording, Scheduling, Dispatching, and Distributing Workers 6%
Construction and Extraction Occupations 7%
Construction Trades Workers 6%
Installation, Maintenance, and Repair Occupations 10%
Other Installation, Maintenance, and Repair Occupations 8%
Industrial Machinery Installation, Repair, and Maintenance Workers 5%
Industrial Machinery Mechanics 6%
Production Occupations 58%
Supervisors of Production Workers 6%
First-Line Supervisors of Production and Operating Workers 6%
Assemblers and Fabricators 10%
Aircraft Structure, Surfaces, Rigging, and Systems Assemblers 8%
Electrical, Electronics, and Electromechanical Assemblers 11%
Electrical, Electronic, and Electromechanical Assemblers, Except Coil Winders, Tapers, and Finishers 11%
Engine and Other Machine Assemblers 6%
Structural Metal Fabricators and Fitters 7%
Miscellaneous Assemblers and Fabricators 7%
Fiberglass Laminators and Fabricators 6%
Assemblers and Fabricators, All Other, Including Team Assemblers 7%
Metal Workers and Plastic Workers 40%
Computer Control Programmers and Operators 10%
Computer-Controlled Machine Tool Operators, Metal and Plastic 8%
Forming Machine Setters, Operators, and Tenders, Metal and Plastic 7%
Extruding and Drawing Machine Setters, Operators, and Tenders, Metal and Plastic 7%
Rolling Machine Setters, Operators, and Tenders, Metal and Plastic 7%
Machine Tool Cutting Setters, Operators, and Tenders, Metal and Plastic 8%
Cutting, Punching, and Press Machine Setters, Operators, and Tenders, Metal and Plastic 6%
Grinding, Lapping, Polishing, and Buffing Machine Tool Setters, Operators, and Tenders, Metal and Plastic 6%
Lathe and Turning Machine Tool Setters, Operators, and Tenders, Metal and Plastic 6%
Machinists 9%
Machinists 9%
Metal Furnace Operators, Tenders, Pourers, and Casters 6%
Metal-Refining Furnace Operators and Tenders 5%
Molders and Molding Machine Setters, Operators, and Tenders, Metal and Plastic 7%
Foundry Mold and Coremakers 9%
Molding, Coremaking, and Casting Machine Setters, Operators, and Tenders, Metal and Plastic 10%
Tool and Die Makers 9%
Welding, Soldering, and Brazing Workers 8%
Welders, Cutters, Solderers, and Brazers 7%
Welding, Soldering, and Brazing Machine Setters, Operators, and Tenders 5%
Miscellaneous Metal Workers and Plastic Workers 20%
Plating and Coating Machine Setters, Operators, and Tenders, Metal and Plastic 15%
Textile, Apparel, and Furnishings Workers 8%
Sewing Machine Operators 10%
Woodworkers 27%
Cabinetmakers and Bench Carpenters 18%
Woodworking Machine Setters, Operators, and Tenders 7%
Woodworking Machine Setters, Operators, and Tenders, Except Sawing 5%
Other Production Occupations 11%
Inspectors, Testers, Sorters, Samplers, and Weighers 6%
Jewelers and Precious Stone and Metal Workers 29%
Medical, Dental, and Ophthalmic Laboratory Technicians 8%
Dental Laboratory Technicians 9%
Painting Workers 11%
Coating, Painting, and Spraying Machine Setters, Operators, and Tenders 11%
Semiconductor Processors 6%
Miscellaneous Production Workers 8%
Transportation and Material Moving Occupations 8%
Material Moving Workers 7%
Laborers and Material Movers, Hand 6%

Government Contracts

The federal government spent an annual total of $140,666,537,332 on the Manufacturing industry. It has awarded 550,663 contracts to 58,445 companies, with an average value of $2,406,819 per company.

Top Companies in Manufacturing and Adjacent Industries

Company Address Revenue
($ Millions)

Included


Market Research Report Details
Geography United States
NAICS Code 31-33
Publication Date November 2025
Report Format PDF Download  PDF
Price $750 $499
Report Objectives

For Private Equity Firms & Investors
  • Analyze unbiased statistics for the Manufacturing market
  • Review historical and forecasted growth trends
  • Benchmark companies against the industry average
For Business Executives
  • Develop a strategy based on concrete statistics
  • Identify opportunities based on market size and growth rates
For Startups
  • Get the information you need for the "Market Analysis" section of your business plan
  • Show market size in the U.S. and by state
For Venture Capital
  • Understand market opportunity and current size
  • Evaluate the market potential of a disruptive technology in the Manufacturing industry

Related Industry Reports

Manufacturing