Retail Trade - Market Size, Financial Statistics, Industry Trends
Industry Overview
The Sector as a Whole The Retail Trade sector comprises establishments primarily engaged in retailing merchandise, generally without transformation, and rendering services incidental to the sale of merchandise. The retailing process is the final step in the distribution of merchandise; retailers are, therefore, organized to sell merchandise in small quantities to the general public. Retail stores are fixed point-of-sale locations, located and designed to attract a high volume of walk-in customers. In general, retail stores have extensive displays of merchandise and use mass-media advertising to attract customers. Retailers often reach customers and market merchandise with methods other than, or in addition to, physical stores, such as Internet websites, the broadcasting of infomercials, the broadcasting and publishing of direct-response advertising, the publishing of paper and electronic catalogs, door-to-door solicitation, in-home demonstration, selling from portable stalls (street vendors, except food), and distribution through vending machines. Establishments engaged in the direct sale and home delivery of products, such as home heating oil dealers and home delivery newspaper routes, are included here. Retail establishments typically sell merchandise to the general public for personal or household consumption, but some also serve business and institutional clients. These include office supply retailers, computer and software retailers, building materials dealers, plumbing supply retailers, and electrical supply retailers. In addition to retailing merchandise, some retailers are also engaged in the provision of after-sales services, such as repair and installation. For example, new automobile dealers, electronics and appliance retailers, and musical instrument and supplies retailers often provide repair services. As a general rule, establishments engaged in retailing merchandise and providing after-sales services are classified in this sector. Retail trade establishments are grouped into industries and industry groups typically based on one or more of the following criteria: (a) The merchandise line or lines carried; for example, specialty retailers are distinguished from general-line retailers. (b) The usual trade designation of the establishments. This criterion applies in cases where a retailer is well recognized by the industry and the public, but difficult to define strictly in terms of merchandise lines carried; for example, pharmacies and department stores. (c) Human resource requirements in terms of expertise; for example, the staff of an automobile dealer requires knowledge in financing, registering, and licensing issues that are not necessary in other retail industries. The buying of goods for resale is a characteristic of retail trade establishments that particularly distinguishes them from establishments in the agriculture, manufacturing, and construction industries. For example, farms that sell their products at or from the point of production are not classified in retail, but rather in agriculture. Similarly, establishments that both manufacture and sell their products to the general public are not classified in retail, but rather in manufacturing. However, establishments that engage in processing activities incidental to retailing are classified in retail. This includes optical goods retailers that grind lenses, and meat and seafood retailers that process carcasses into cuts. Wholesalers also engage in the buying of goods for resale, but they are not usually organized to serve the general public. They typically operate from a warehouse or office, and neither the design nor the location of these premises is intended to solicit a high volume of walk-in traffic. Wholesalers supply institutional, industrial, wholesale, and retail clients; their operations are, therefore, generally organized to purchase, sell, and deliver merchandise in larger quantities. However, dealers of durable nonconsumer goods, such as farm machinery and heavy-duty trucks, are included in wholesale trade even if they often sell these products in single units.Source: U.S. Census Bureau
Retail Trade Market Size
This report includes historical and forecasted market sizes and industry trends for Retail Trade. It reveals overall market dynamics from 2020 through the present, and predicts industry growth or shrinkage through 2030. Revenue data include both public and private companies in the Retail Trade industry.| Historical | Forecasted | ||||||||||
|---|---|---|---|---|---|---|---|---|---|---|---|
| 2020 | 2021 | 2022 | 2023 | 2024 | 2025 | 2026 | 2027 | 2028 | 2029 | 2030 | |
| Market Size (Total Revenue) | Included in Report |
||||||||||
| % Growth Rate | |||||||||||
| Number of Companies | |||||||||||
| Total Employees | |||||||||||
| Average Revenue per Company | |||||||||||
| Average Employees per Company | |||||||||||
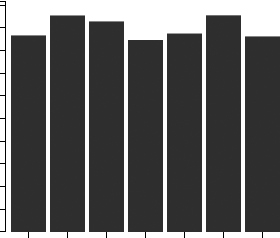
Industry Revenue ($ Billions)

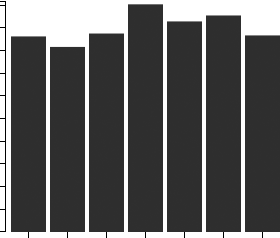
Industry Forecast ($ Billions)

Pell Research's advanced econometric models forecast five years of industry growth based on short- and long-term trend analysis. Market size statistics include revenue generated from all products and services sold within the Retail Trade industry.
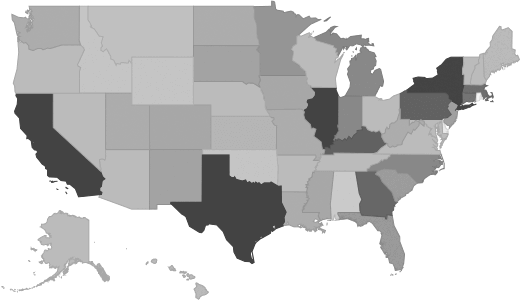
Geographic Breakdown by U.S. State
Retail Trade market share by state pinpoints local opportunities based on regional revenue statistics. Growth rate for each state is affected by regional economic conditions. Data by state can be used to locate profitable and nonprofitable locations for Retail Trade companies in the United States.Industry Revenue by State [Sample]

Distribution by Company Size
| Company Size | All Industries | Retail Trade |
|---|---|---|
| Small Business (< 5 Employees) | Included |
|
| Small Business (5 - 20) | ||
| Midsized Business (20 - 100) | ||
| Large Business (100 - 500) | ||
| Enterprise (> 500) | ||
Industry Income Statement (Average Financial Metrics)
Financial statement analysis determines averages for the following industry forces:- Cost of goods sold
- Compensation of officers
- Salaries and wages
- Employee benefit programs
- Rent paid
- Advertising and marketing budgets
The report includes a traditional income statement from an "average" Retail Trade company (both public and private companies are included).
| Industry Average | Percent of Sales | |
|---|---|---|
| Total Revenue | Included |
|
| Operating Revenue | ||
| Cost of Goods Sold (COGS) | ||
| Gross Profit | ||
| Operating Expenses | ||
| Operating Income | ||
| Non-Operating Income | ||
| Earnings Before Interest and Taxes (EBIT) | ||
| Interest Expense | ||
| Earnings Before Taxes | ||
| Income Tax | ||
| Net Profit | ||
Average Income Statement

Cost of Goods Sold
Salaries, Wages, and Benefits
Rent
Advertising
Depreciation and Amortization
Officer Compensation
Net Income
Financial Ratio Analysis
Financial ratios allow a company's performance to be compared against that of its peers.| Financial Ratio | Industry Average |
|---|---|
| Profitability Ratios | Included |
| Profit Margin | |
| ROE | |
| ROA | |
| Liquidity Ratios | |
| Current Ratio | |
| Quick Ratio | |
| Activity Ratios | |
| Average Collection Period | |
| Asset Turnover Ratio | |
| Receivables Turnover Ratio | |
| Inventory Conversion Ratio |
Compensation and Salary Surveys
Salary information for employees working in the Retail Trade industry.| Title | Percent of Workforce | Bottom Quartile | Average (Median) Salary | Upper Quartile |
|---|---|---|---|---|
| Management Occupations | 3% |
Included |
||
| Chief Executives | 0% | |||
| General and Operations Managers | 2% | |||
| Business and Financial Operations Occupations | 6% | |||
| Business Operations Specialists | 6% | |||
| Computer and Mathematical Occupations | 6% | |||
| Computer Occupations | 6% | |||
| Arts, Design, Entertainment, Sports, and Media Occupations | 44% | |||
| Art and Design Workers | 44% | |||
| Designers | 44% | |||
| Floral Designers | 44% | |||
| Food Preparation and Serving Related Occupations | 6% | |||
| Food and Beverage Serving Workers | 5% | |||
| Fast Food and Counter Workers | 5% | |||
| Personal Care and Service Occupations | 11% | |||
| Animal Care and Service Workers | 10% | |||
| Nonfarm Animal Caretakers | 9% | |||
| Nonfarm Animal Caretakers | 9% | |||
| Sales and Related Occupations | 74% | |||
| Supervisors of Sales Workers | 8% | |||
| First-Line Supervisors of Sales Workers | 8% | |||
| First-Line Supervisors of Retail Sales Workers | 8% | |||
| Retail Sales Workers | 65% | |||
| Cashiers | 8% | |||
| Cashiers | 8% | |||
| Retail Salespersons | 56% | |||
| Retail Salespersons | 56% | |||
| Office and Administrative Support Occupations | 11% | |||
| Information and Record Clerks | 17% | |||
| Customer Service Representatives | 11% | |||
| Customer Service Representatives | 11% | |||
| Order Clerks | 5% | |||
| Order Clerks | 5% | |||
| Material Recording, Scheduling, Dispatching, and Distributing Workers | 5% | |||
| Shipping, Receiving, and Traffic Clerks | 7% | |||
| Shipping, Receiving, and Traffic Clerks | 7% | |||
| Stock Clerks and Order Fillers | 17% | |||
| Stock Clerks and Order Fillers | 17% | |||
| Other Office and Administrative Support Workers | 5% | |||
| Office Clerks, General | 5% | |||
| Office Clerks, General | 5% | |||
| Installation, Maintenance, and Repair Occupations | 6% | |||
| Other Installation, Maintenance, and Repair Occupations | 5% | |||
| Heating, Air Conditioning, and Refrigeration Mechanics and Installers | 7% | |||
| Heating, Air Conditioning, and Refrigeration Mechanics and Installers | 7% | |||
| Miscellaneous Installation, Maintenance, and Repair Workers | 29% | |||
| Coin, Vending, and Amusement Machine Servicers and Repairers | 29% | |||
| Transportation and Material Moving Occupations | 5% | |||
| Motor Vehicle Operators | 17% | |||
| Driver/Sales Workers and Truck Drivers | 17% | |||
| Driver/Sales Workers | 20% | |||
| Heavy and Tractor-Trailer Truck Drivers | 12% | |||
| Light Truck or Delivery Services Drivers | 16% | |||
| Material Moving Workers | 11% | |||
| Laborers and Material Movers, Hand | 10% | |||
| Laborers and Freight, Stock, and Material Movers, Hand | 6% | |||
Government Contracts
The federal government spent an annual total of $215,518,357 on the Retail Trade industry. It has awarded 10,186 contracts to 1,080 companies, with an average value of $199,554 per company.Top Companies in Retail Trade and Adjacent Industries
| Company | Address | Revenue ($ Millions) |
|---|---|---|
Included |
||
