Household Cooking Appliance Manufacturing Industry: Statistics, Forecasts, and Company Data

Household Cooking Appliance Manufacturing - Market Size and Industry Forecast

The 2023 Household Cooking Appliance Manufacturing Industry Report contains historical and forecasted statistics used by leading private equity firms and consultants. Market sizes from 2018 to 2028 reflect industry trends and growth patterns. Revenues include both public and private companies in the household cooking appliance manufacturing industry.

HistoricalForecasted
20182019202020212022202320242025202620272028
Market Size (Total Revenue)

% Growth Rate
Number of Companies
Total Employees
Average Revenue per Company
Average Employees per Company
Source: U.S. government financial data.

Industry Revenue ($ Billions)

Industry Market Size
  • 2016
  • 2017
  • 2018
  • 2019
  • 2020
  • 2021
  • 2022


Advanced econometric models forecast five years of industry growth based on short- and long-term trend analysis. Market size includes revenue generated from all products and services sold within the industry.

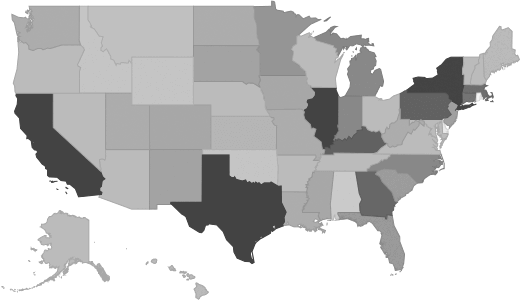
Household Cooking Appliance Manufacturing - Geographic Breakdown by U.S. State

Market size by state reveals local opportunity through the number of companies located in the region. Each state's growth rate is affected by regional economic conditions. Data by state can be used to pinpoint profitable and nonprofitable locations for Household Cooking Appliance Manufacturing companies in the United States.

Household Cooking Appliance Manufacturing Revenue by State

Market Size by State

Distribution by Company Size

Company SizeAll IndustriesHousehold Cooking Appliance Manufacturing
Small Business (< 5 Employees)

Small Business (5 - 20)
Midsized Business (20 - 100)
Large Business (100 - 500)
Enterprise (> 500)

Household Cooking Appliance Manufacturing - Income Statement (Average Financial Metrics)

Financial statement analysis determines averages for the following industry forces:
The report includes a traditional income statement from an "average" company (both public and private companies included).

Industry AveragePercent of Sales
Total Revenue

Operating Revenue
Cost of Goods Sold (COGS)
Gross Profit
Operating Expenses
Operating Income
Non-Operating Income
Earnings Before Interest and Taxes (EBIT)
Interest Expense
Earnings Before Taxes
Income Tax
Net Profit


Average Income Statement

Average Income Statement

Cost of Goods Sold

Salaries, Wages, and Benefits

Rent

Advertising

Depreciation and Amortization

Officer Compensation

Net Income


Household Cooking Appliance Manufacturing - Financial Ratio Analysis

Financial ratios allow a company's performance to be compared against that of its peers.

Financial RatioIndustry Average
Profitability Ratios

Profit Margin
ROE
ROA
Liquidity Ratios
Current Ratio
Quick Ratio
Activity Ratios
Average Collection Period
Asset Turnover Ratio
Receivables Turnover Ratio
Inventory Conversion Ratio

Household Cooking Appliance Manufacturing - Product Mix

Product DescriptionDescriptionRevenue
($ Millions)

Household cooking appliance manufacturing

Electric household ranges, ovens, surface cooking units/equip.

Gas household ranges/ovens/surface cooking units, & equip.

Other household ranges and cooking equipment

Other household ranges and cook equip. (exc. gas and electric)

Household cooking appliance manufacturing, nsk, total

Household cooking appliance mfg, nsk, admin-records


Household Cooking Appliance Manufacturing - Compensation and Salary Surveys

TitlePercent of WorkforceBottom QuartileAverage (Median) SalaryUpper Quartile
Management Occupations5%

Chief Executives0%
General and Operations Managers1%
Business and Financial Operations Occupations8%
Business Operations Specialists7%
Architecture and Engineering Occupations9%
Engineers7%
Office and Administrative Support Occupations10%
Production Occupations50%
Assemblers and Fabricators33%
Miscellaneous Assemblers and Fabricators28%
Assemblers and Fabricators, All Other, Including Team Assemblers28%
Metal Workers and Plastic Workers10%
Other Production Occupations5%
Transportation and Material Moving Occupations8%
Material Moving Workers8%

Government Contracts

In the past, the federal government spent an annual total of $2,647,798 on the household cooking appliance manufacturing industry. It has awarded 149 contracts to 57 companies, with an average value of $46,453 per company.

Household Cooking Appliance Manufacturing and Adjacent Industries - Top Companies

CompanyAddressRevenue
($ Millions)


Household Cooking Appliance Manufacturing Industry Report
GeographyUnited States  
Publication DateDecember 2023
Report FormatPDF Download  
Price

Related Market Research Reports

Electrical Equipment, Appliance & Component Manufacturing
Electric Lighting Equipment Manufacturing
Light Bulb Manufacturing
Light Bulb & Part Manufacturing
Lighting Fixture Manufacturing
Residential Electric Lighting Fixture Manufacturing
Commercial, Industrial & Institutional Electric Lighting Fixture Manufacturing
Household Appliance Manufacturing
Small Electrical Appliance & Fan Manufacturing
Household Vacuum Cleaner Manufacturing
Fan, Vacuum & Small Electrical Appliance Manufacturing
Electric Housewares & Household Fan Manufacturing
Household Laundry Equipment Manufacturing
Household Cooking Appliance Manufacturing
Household Refrigerator & Home Freezer Manufacturing
Major Appliance Manufacturing
Electrical Equipment Manufacturing
Power, Distribution & Specialty Transformer Manufacturing
Motor & Generator Manufacturing
Switchgear & Switchboard Apparatus Manufacturing
Relay & Industrial Control Manufacturing
Battery Manufacturing
Storage Battery Manufacturing
Primary Battery Manufacturing
Communication & Energy Wire & Cable Manufacturing
Fiber Optic Cable Manufacturing
Wiring Device Manufacturing
Current-Carrying Wiring Device Manufacturing
Noncurrent-Carrying Wiring Device Manufacturing
Carbon & Graphite Product Manufacturing